KPI reporting (Key performance indicators reporting) is a flexible tool that can be adapted to different contexts and industries to help organizations track and improve their performance over time. KPI reporting is often a part of Monitoring and Evaluation (M&E) which is a broader process of tracking and assessing the progress and impact of a project or program. KPIs are a key element of M&E, as they are used to measure the performance and effectiveness of a project or program toward achieving its objectives.
Reporting on Key Performance Indicators (KPIs) that are used to measure the success or progress of a business or organization toward achieving its goals and objectives. KPI Reporting helps to identify areas of improvement, make informed decisions, and monitor performance over time.
KPI Reporting in M&E
KPI reporting is an essential component of M&E because they provide a way to measure progress and determine whether or not an intervention or project is achieving its desired outcomes. KPIs can be used to track various aspects of performance such as efficiency, effectiveness, quality, and impact. KPIs can take the form of qualitative or quantitative measurements, and they are frequently derived from goals and objectives that are specific to a particular project.
How to use KPI reporting in the M&E?
KPI reporting can be a valuable tool in M&E, as it provides a way to measure progress towards achieving desired outcomes and communicate this progress to stakeholders. Here are some ways to use KPI reporting in M&E:
Set clear KPIs
Choose the Right KPIs for Your organization
To measure the performance of your organization you need to find out the potential KPs you can consider.
Program attendance: This KPI measures the number of people who attend NGO-run programs and events.
Volunteer engagement: This KPI measures the number of volunteers involved in the NGO’s programs and events.
Donations received: This KPI measures the amount of money donated to the NGO by individuals, foundations, corporations, and other entities.
Fundraising success: This KPI measures the success of the NGO’s fundraising efforts, such as the number of successful grant applications or the percentage of donations that meet fundraising targets.
Impact on beneficiaries: This KPI measures the impact of the NGO’s programs and services on the lives of its beneficiaries.
Community engagement: This KPI measures the level of engagement and support that the NGO receives from the communities it serves.
Sustainability: This KPI measures the NGO’s ability to maintain its programs and services over the long term.
Partnerships and collaborations: This KPI measures the number and quality of partnerships and collaborations the NGO has established with other organizations, government entities, and community groups.
Staff and volunteer satisfaction: This KPI measures the satisfaction levels of staff and volunteers working for the NGO, which can help to assess the organization’s overall health and sustainability.
It is important to define KPIs that are specific, measurable, and aligned with project goals and objectives. This will help ensure that progress can be accurately tracked and reported on.
Setting Targets and Benchmarks for Your KPIs
Once you’ve selected your KPIs, it’s important to set targets and benchmarks for each one. Targets are specific goals that you want to achieve, while benchmarks are comparison points that help you evaluate your performance over time. Here are some steps to help you set targets and benchmarks for your KPIs:
Establish baseline data: Start by establishing baseline data for each KPI. This will help you understand where you currently stand and provide a starting point for setting targets
Set realistic targets: Next, set realistic targets for each KPI. These targets should be based on your NGO’s capacity, resources, and past performance. You may want to set both short-term and long-term targets and adjust them as needed based on your progress.
Define benchmarks: Finally, define benchmarks for each KPI. These benchmarks should be based on industry standards, best practices, or your organization’s past performance. They should also be updated over time as your NGO’s performance improves.
Collect data
Data collection is essential to tracking progress toward KPIs. Organizations should establish a system for collecting and analyzing data that is reliable, accurate, and timely.
Define data collection methods: Depending on the KPI, data collection methods may include surveys, interviews, focus groups, observations, or other methods. It is important to identify the most appropriate data collection method for each KPI.
Establish data collection protocols: Once data collection methods have been identified, establish protocols for collecting and recording data. This may include standardizing data collection tools, setting up systems for tracking data, and ensuring that data is collected consistently across different locations and periods.
Train data collectors: Anyone responsible for collecting data should receive training on the data collection protocols and tools to ensure that data is collected accurately and consistently.
Monitor data quality: It is important to monitor the quality of the data collected to ensure that it is accurate, complete, and reliable. This may involve regular data checks, audits, or other quality control measures.
Store data securely: Data should be stored securely to protect it from loss, theft, or unauthorized access. This may include storing data on secure servers, using password-protected files, or other security measures.
Collecting data for KPI reporting requires careful planning, attention to detail, and a commitment to quality. By following these steps, organizations can ensure that the data they collect is accurate, reliable, and useful for informing decision-making and improving performance.
Analyze data
Once data has been collected, it is important to analyze it to identify trends and patterns. This will help to identify areas where performance is falling short and where improvements can be made.
Define analysis objectives: Before beginning data analysis, it is important to define the objectives of the analysis. What questions do you want the data to answer? What insights are you hoping to gain from the analysis?
Clean and prepare the data: Raw data often contains errors, inconsistencies, and missing values. It is important to clean and prepare the data before analyzing it. This may involve removing duplicate records, filling in missing values, and correcting errors.
Choose appropriate analytical techniques: Depending on the KPI and the type of data being analyzed, different analytical techniques may be used. These techniques may include descriptive statistics, regression analysis, trend analysis, or other methods.
Visualize the data: Visualization can be a powerful way to analyze data and communicate insights. This may involve creating charts, graphs, or other visualizations that help to highlight trends, patterns, and outliers in the data.
Interpret the results: Once the data has been analyzed, it is important to interpret the results. What do the results mean? What insights can be gained from the analysis? This interpretation will help to guide decision-making and inform strategies for improving performance.
Communicate the results: Finally, it is important to communicate the results of the data analysis to stakeholders. This may involve creating reports, presentations, or other materials that summarize the findings and highlight key insights.
Create KPI Reports and Dashboards
After collecting and analyzing your data, it’s time to create KPI reports and dashboards to communicate your findings to stakeholders. Using the data and analysis, create the report on progress towards the KPIs. The report should be clear, concise, and focused on the most important information. It should also include visualizations or other graphics to help communicate the information effectively. Here are some tips to help you create effective KPI reports and dashboards:
Keep it simple: Keep your KPI reports and dashboards simple and easy to understand. Use visuals such as charts, graphs, or tables to present your data clearly and concisely.
Customize your reports: Customize your reports to meet the needs of your stakeholders. This may include creating different reports for different audiences, such as donors, volunteers, or board members.
Include narrative: Use narrative to provide context and insight into your data. This may include highlighting key findings, explaining trends, or providing recommendations for improvement.
Report progress
Regular reporting on progress toward KPIs is important to keep stakeholders informed and engaged. Reports should be clear, concise, and focused on the most important KPIs.
Share the report: Once the report has been created, share it with relevant stakeholders. This may involve presenting the report at meetings, sending it via email, or publishing it on a website or other platform.
Use the report to drive improvement: Finally, use the information in the report to drive improvement. This may involve identifying areas for improvement and developing strategies to address them, or sharing the report with decision-makers to inform their decision-making.
Be consistent: Be consistent in your data collection and reporting methods to ensure accuracy and reliability.
Use SMART goals: Use SMART goals (Specific, Measurable, Attainable, Relevant, and Time-bound) to ensure your KPIs are meaningful and achievable.
Involve stakeholders: Involve stakeholders in the KPI reporting process by soliciting their feedback and input on KPI selection, target-setting, and reporting methods.
Use KPI data to inform decision-making
KPI data can be used to inform decisions about project design, resource allocation, and performance improvement. By analyzing KPI data, organizations can identify opportunities for optimization and make data-driven decisions.
Overall, KPI reporting can be a powerful tool in M&E, providing a way to measure progress toward achieving desired outcomes and communicate this progress to stakeholders. By setting clear KPIs, collecting and analyzing data, reporting on progress, and using KPI data to inform decision-making, organizations can optimize performance and demonstrate impact.
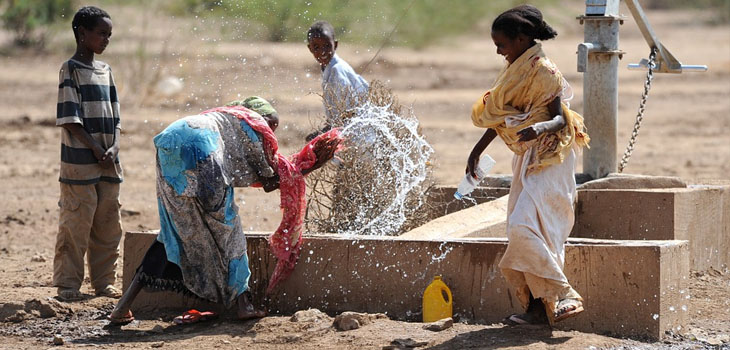
Here is an example of KPI reporting for an NGO that works to improve access to clean water in rural communities:
Set clear KPIs
KPI: Number of people with access to clean water
Target: 10,000 people
Reporting period: January to March 2023
Collect data
Data collection involved conducting surveys and site visits to determine the number of people with access to clean water in the target communities.
Analyze data:
The data collected were analyzed to identify the number of people with access to clean water each month and to compare the results against the target.
January: 2,500 people
February: 3,000 people
March: 4,500 people
Analysis:
The NGO is making progress towards its target of providing access to clean water for 10,000 people.
The number of people with access to clean water increased each month during the reporting period.
The NGO may need to increase its efforts to reach its target, as it has only reached 45% of its target by the end of March.
Create KPI Reports and Dashboards:
The results were compiled into a KPI report and dashboard that showed the number of people with access to clean water each month, as well as the cumulative number of people reached. The dashboard included visualizations such as line graphs and pie charts to help convey the information.
Report progress:
The KPI report was shared with stakeholders such as NGO staff, funders, and partner organizations. It was also presented at meetings and shared via email and online platforms.
Use KPI data to inform decision-making:
The NGO used the KPI data to inform its decision-making and adjust its strategies as needed to achieve its goals. For example, based on the data, the NGO increased outreach efforts to identify and reach communities that lack access to clean water, worked with local partners to ensure that water systems were installed and maintained properly, and increased fundraising efforts to support the expansion of its clean water programs.
Recommendations
Increase outreach efforts to identify and reach communities that lack access to clean water.
Work with local partners to ensure that water systems are installed and maintained properly.
Increase fundraising efforts to support the expansion of the NGO’s clean water programs.
Overall, this KPI report provides information on progress toward the NGO’s goal of providing access to clean water for 10,000 people. It includes actual results, analysis of those results, and recommendations for improving performance. This information can be used by the NGO to make data-driven decisions and adjust its strategies as needed to achieve its goals.
proposalsforNGOs is an online community for global development professionals with the goal of increasing the sustainability of NGOs around the world. The enormous growth in funding opportunities, as well as NGOs over time, has made fundraising more competitive.